Google Analytics is a widely used analytics service that gathers statistics about website and app visitors once special counters have been installed on them.
Any marketer will tell you how crucial it is to understand your audience. Google Analytics can help you avoid wandering in the darkness of ignorance by processing the information you receive from sites and apps, reporting on visits, conversions, geolocation, operating systems, and much more. Google Analytics is made up of a variety of report types and options that allow you to customize the analytics for your project.
The service has both free and paid features, but even the free version is suitable for large projects and large-scale tasks.
To discover other useful marketing tools and learn how to create smart retargeting campaigns, refer to our article on Marketing Tools.
How does it work?
- You create your account on Google Analytics, where the account is not the website itself, but a folder for your projects. Accounts can have more than one data flow identifier.
- Next, you create a resource. This is where you start working directly with the site or app.
- Enter a name, usually the domain of the project, and fill in your data.
- You can then set up your data collection by specifying the source type: website, Android app, or iOS app. Google’s tooltips and instructions will help you do this quickly.
Done! You’re ready to monitor your project closely.
For Google Analytics to collect data about your site, you need to install a counter. This is a script that loads on every page, collects statistics, and sends them to Google.
There are several ways to set up a counter:
- Insert the script into the site code.
- Use “Google Tag Manager” to plug the container script into the site.
- Use a plugin for WordPress. All you have to do is specify your Google Analytics account ID.
- Use your website builder.
Now you can find out how engaged users are with your AR project using Google Analytics:
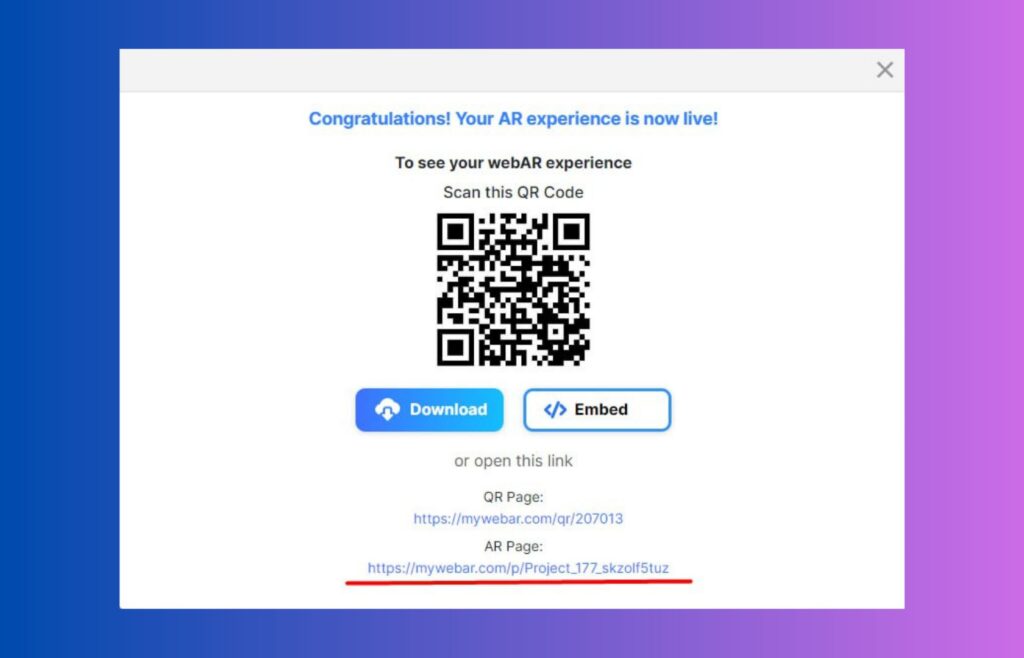
1) Go to the DEVAR (MyWebAR) platform and select the project (or create a new one) whose activity you want to monitor.
2) Copy the link to the project.
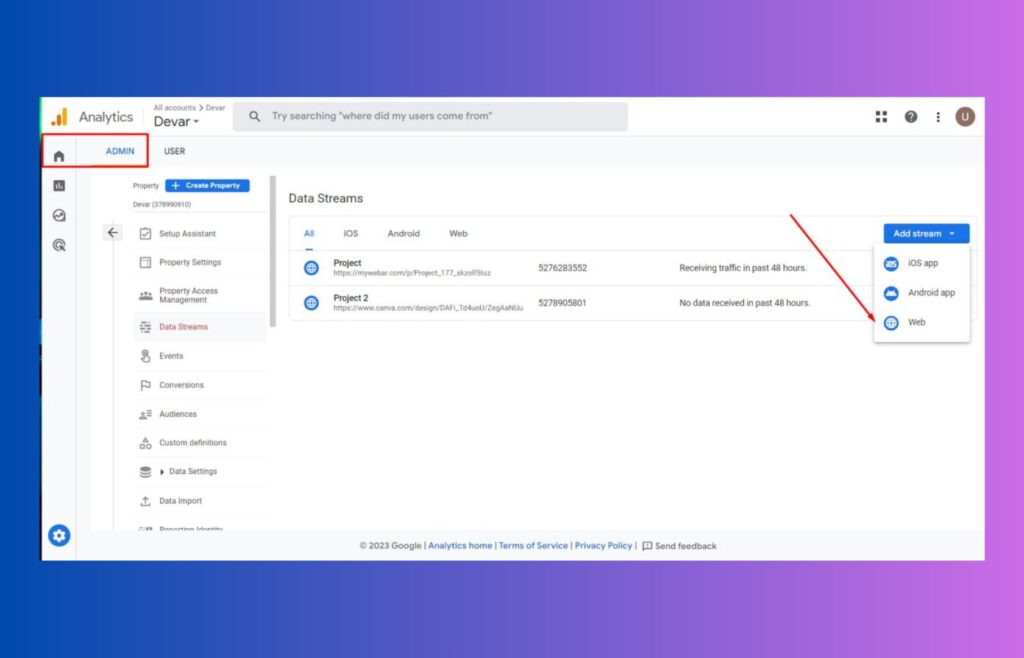
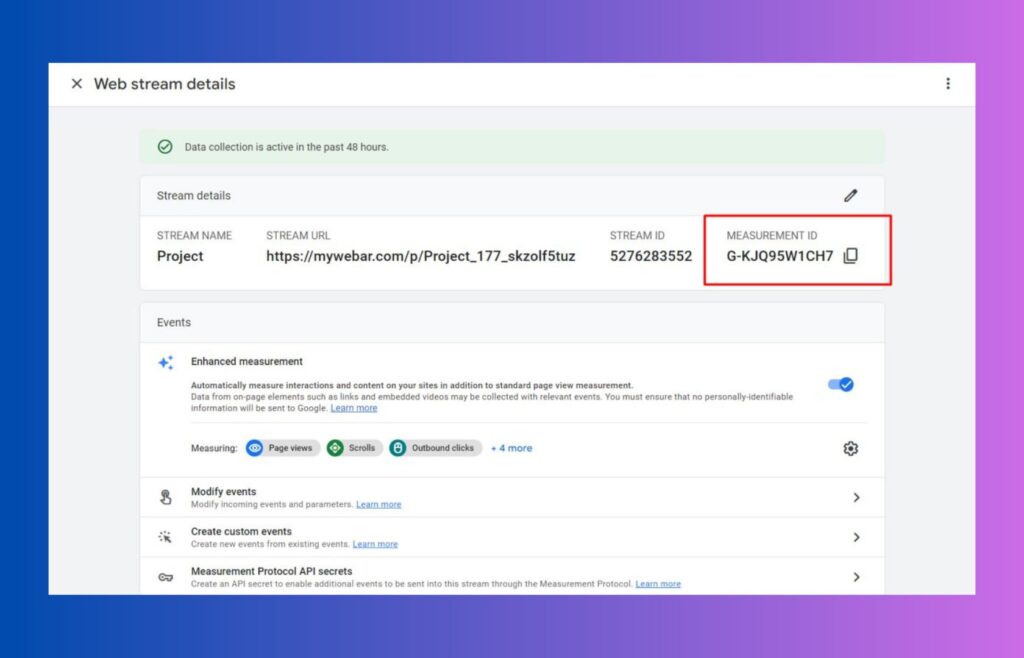
3) Go to your Google Analytics account. Create a new Stream Web.
4) Paste the link to the project. Note that https:// (http://) already exists and you need to add the link without these characters. Give a name to the stream.
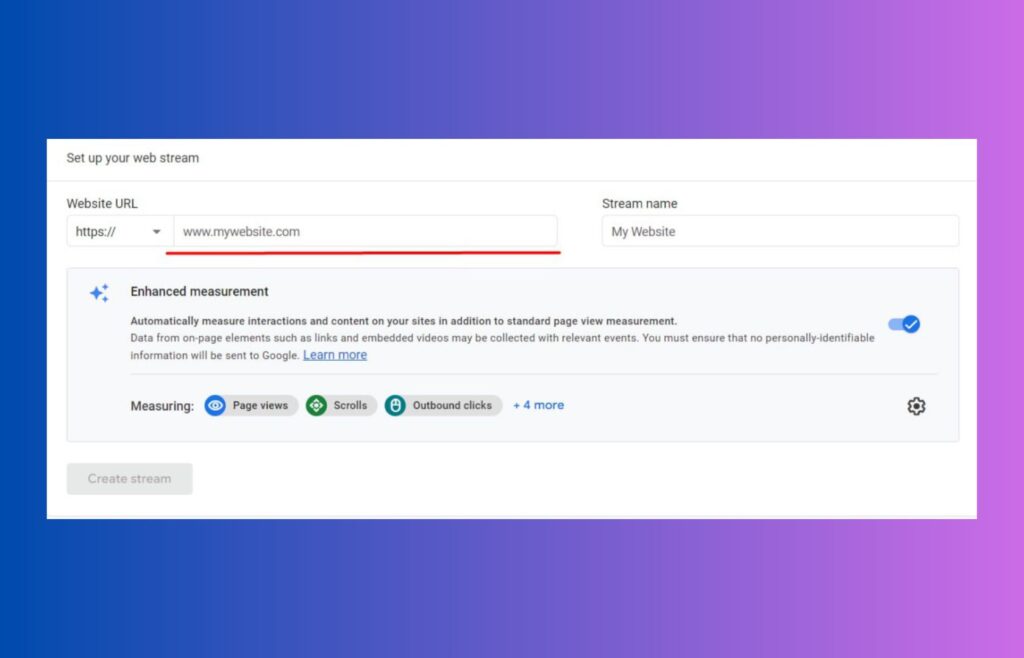
5) Now you will open a window of created stream. Copy its ID.
6) Navigate back to DEVAR (MyWebAR) and locate the “Extensions” tab on the left-hand side of the screen within the project.
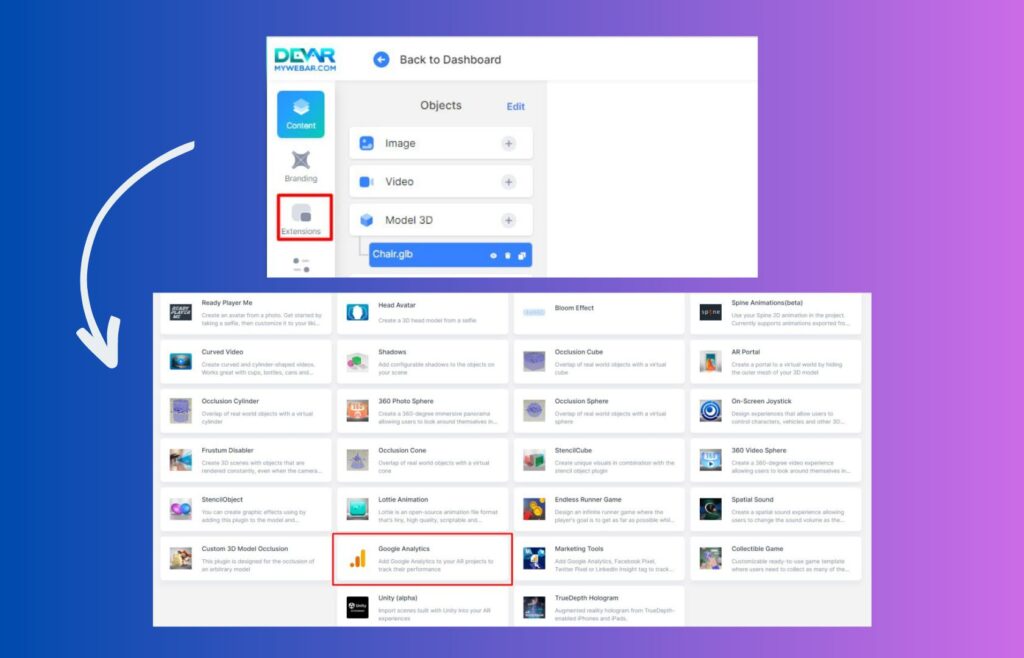
7) Find the Google Analytics extension. Download it.
8) In Objects, find the added extension. Click on the “+”. A box will appear where you need to place the Google Analytics ID. You’ve already copied it, so just paste the number into the blank box.
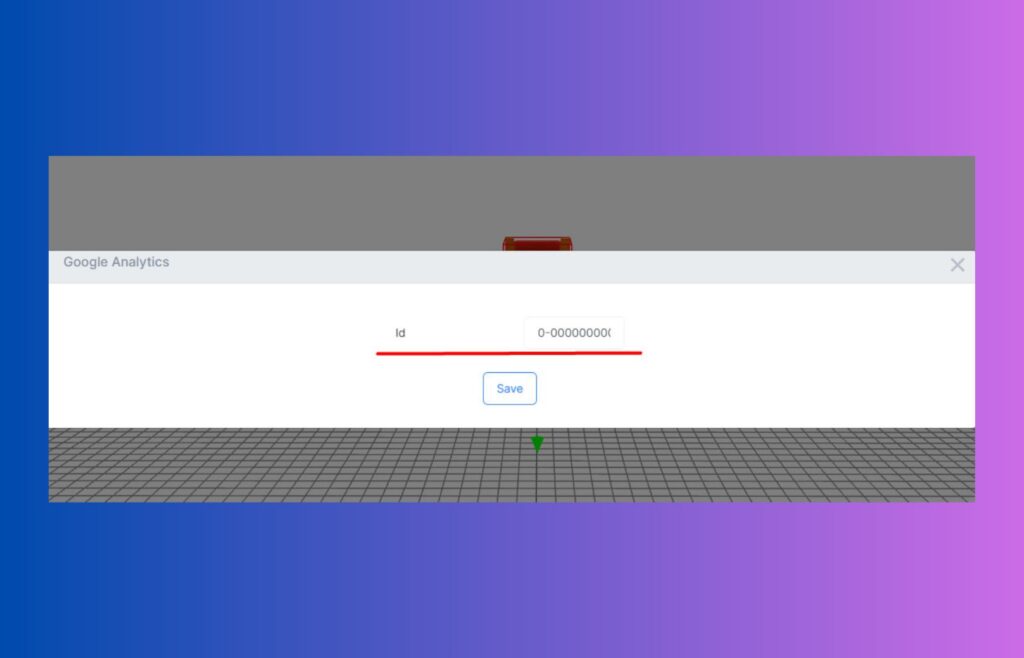
Done! You will now be able to track all of your project data in AR!
Note: Data may not appear in reports immediately.
Google Analytics provides two types of data: parameters and metrics. The analytics tools measure various visit parameters, such as user geolocation and traffic source, which are located in the left column of the report. Metrics show the numerical values of the parameters being measured, such as bounce rate, session duration, and number of users.
All reports in Google Analytics are customizable, allowing you to set up reports that meet the specific needs of your project. You can easily add or remove any filter from the table.
The most frequently visited report in the service is the traffic report, which provides information on:
- General audience data, including the number of pages viewed, new visitors, and the number of unique and repeat sessions.
- Audience characteristics, such as user activity and engagement, geolocation, and number of pages visited.
- Depth of view, which gives an idea of how deep into the site (or application) a user goes in one session and their dwell time.
- Bounce rate, which evaluates very short visits as abandonment. This means that visitors were not interested in the resource information, so they quickly closed the page.
- Returns, which show people’s interest in an offer or project. The higher this figure, the better the site is rated by users and search engines.
The information from the analytics service reports can help determine the effectiveness of the project and pinpoint errors in design, positioning, advertising, and marketing.
This also applies to AR projects. You can experiment with QR code placement, find out which products are scanned most often, which promotions are in the highest demand, and compare that with your final sales.
Now, nothing is hidden from your view!
Best regards,
DEVAR (MyWebAR) Team